Sponsored by:


A Deep Dive Look at Today’s Pizzerias and Pizza Industry Trends
By Denise Greer and Jeremy White
Giving today’s restaurant business climate, it has never been more important to embark upon a comprehensive, deep dive study of the pizzeria industry for the pizzeria industry. The goal of our analysis is to provide you, pizzeria operators and pizza professional, with a gauge of vital pizzeria insights, issues and trends. We surveyed 750 pizzeria owners from all 50 states to see what’s happening in America’s pizzerias. We combed through surveys, national reports and key industry indicators to bring you the State of the Pizzeria Industry.
A Pizza Industry Overview – What We’ve Learned
Some over-arching themes from the pizza industry report data
As we pored over the data coming in for our Industry Report, there were some intermittent chuckles. Sometimes because our reaction was, “Of course. We totally expected that.” Other times we had a pleasant surprise. This is why you acquire and crunch data!
Two of the overarching themes that emerged from the data is something we already anecdotally knew: sales and employees are the “big ticket items” on the minds of pizzeria operators today.
When asked their top three priorities for 2023, 65% answered “maintain current business.” 65% also answered “grow sales.” 38.7 percent included “add employees.”
Food costs are no doubt rising, but our respondents have done a fairly nice job of pricing accordingly to keep them in check. It’s a sign that folks began listening to our mantra, several months back, when we repeated over and over again — raise prices! Still, 34.2 percent have a food cost between 29-35 percent. Obviously, we’d like to see that number drop a bit. 30.4 percent have a food cost between 23-28 percent, and that’s more in line with what we want to hear for your business health!
We recognize it can be difficult to price when you’re playing Russian Roulette with menu items. Supply chain disruptions have made it difficult for many to keep consistent stock. A whopping 81 percent experienced supply chain disruptions in the past 12 months, according to our survey data. Meats, pizza boxes and other packaging/paper products were the hardest hit. Those unexpected (or at least ill-timed and sporadic) inconsistencies make pricing difficult.
As we look over the various numbers the survey generated, here are some interesting tidbits and short analysis.
- Optimism exists. 44.3 percent of our 754 survey respondents say they anticipate a sales increase in 2023. That may seem optimistic considering a potential recession could be lurking around the corner. But there is reason for optimism. Show us a major foodservice segment that fares better than pizza in lean economic times. We’ll wait. This is likely why 36% said they are somewhat optimistic about their business outlook over the next 12 months, while 31% are “very” optimistic.
- Pay is rising. 83.2 percent of pizzeria owners increased employee wages in 2022. One-fourth of them upped pay by 7-11%. Let’s face it: it needed to happen. The landscape got ultra-competitive as the labor pool tightened and employees left the industry in droves during the “Great Resignation.” In order to keep good talent moving forward, operators are going to have to be leaders in their communities when it comes to pay, benefits, flexible scheduling, etc. Quality of life is at the forefront of Americans’ minds post-pandemic. Work to live vs. live to work, you know.
- The buffet is dead. Okay, that’s harsh. But, really, it’s not what it once was. Maybe COVID is to blame, or maybe consumer behaviors are just changing in the first place. But here’s the rub: only 7% of our respondents said they still offer a buffet at some point during the business day.
- Fine dining pizza still exists. But it’s even more dead than the buffet. A total of 2% of pizzeria owners responding to the industry report survey say their business falls into the fine dining category. No surprise there — pizza is commoner street food. We all know that. Even those who seek to elevate it do so without wishing to completely obliterate its heritage as a food of the people.
- Independents remain proud, strong, vibrant. 58.1 percent of our survey responses came from single-unit pizzeria owners. 22% own 2-9 units. It’s like we surveyed the Pizza Expo show floor or something. Independents remain the backbone of this industry!
- The industry is more affluent. 19.8 percent of respondents report doing $2 million or more in gross sales. We can remember the day when $1 million was rare. It was the dream benchmark. 38.3 percent now report $1 million or more in sales. The single almighty dollar ain’t what it used to be. With inflation driving up prices across the board, we’ll continue to see higher ticket averages in the future. The trick for operators will be to maintain profit margins.
- Butts in seats matter. But not like they used to since the pandemic. In fact, 21.3 percent on survey respondents say they don’t have any seating at all in their pizzerias. The most common seating capacity was 20 or fewer (21.3%). Second most was 21-50 (20.7%). It appears the days of large 100-seat showplaces are behind us. As consumer preference shifts to on-the-run options, pizzerias that offer dine-in can do so on a smaller scale moving forward, we think.
- Merch madness! People like to rock out your brand, assuming you have a good one. 22.8 percent of pizzeria owners say merchandise provides ancillary income to their business. It’s the fourth-most popular driver of additional revenue behind catering (54.1 percent), third-party delivery (35.8 percent) and beer/liquor to-go (23.1 percent). T-shirts, hoodies, hats and more with your logo are a no-brainer, really. If you can get fans to buy the opportunity to market your brand in public for you, why wouldn’t you?
- The industry remains slow to adapt to technology. 26.4 percent of pizzeria operators still do not offer online ordering. This, quite frankly, is alarming. Especially considering the higher check averages and fewer mistake orders that accompany online ordering.
- Insuring employees on the rise. 28.7% of pizzeria owners say they provide medical insurance. 19.3 percent offer dental insurance. This helps ease financial strain and stress on restaurant workers.
- Pizza remains king. Pizza as a percentage of food sales is 80% or higher in nearly half of pizzerias (48.6%), according to our survey data. Listen, yes, we already knew pizza was king. But it just feels nice to say it out loud, doesn’t it? The most-offered menu item next to pizza? 86.8% offer salads.
- Dough masters. 89.5 percent of pizzerias are making dough in house. That speaks volumes to the industry’s dedication to the craft, doesn’t it?
Now let’s dive into the specific topics addressed in the State of the Pizzeria Industry survey.

Sound Off!
Be sure to listen in to some upcoming episodes of the Hot Slice podcast where Jeremy and Denise will offer analysis, opinions and more on what we learned from the industry report survey. Explore podcast episodes.

The Independent Pizzeria Market Breakdown
Sponsored by:
The Independent Pizzeria Market is made up of single unit operations and multiple unit operations, with the single-unit operation dominating the market. Of the 754 operators surveyed, 479 were independent pizzeria operators with nine or fewer locations. Amongst independent operation respondents surveyed, 73 percent of the pizzerias were single unit, while the remaining 27 percent operated two to nine units.
Today’s pizzeria operators are younger than they were 10 years ago when the average age of a pizzeria owner was 56. Over half of pizzeria operators are under the age of 55 (56%), and 26 percent are under the age of 45.
During the height of the COVID-19 pandemic, we surveyed the industry and found that the top three concept segments (in order of largest percentage) include Casual Dining, Fast Casual/Build-to-Order and Carryout and Delivery Only. The breakdown is holding strong in 2022 with those three market segments making up 89 percent of the independent pizzeria market. Casual Dining is the leading concept at 43 percent, followed by fast casual/build-to-order at 29.4 percent and Delivery & Carryout Only (DELCO) represents 16.5 percent.
Seating capacity varies by unit. Nearly 60 percent of pizzerias have 50 or fewer seats. In contrast, roughly 14 percent of pizzerias have 101 seats or more. Over 56 percent have outdoor seating.
Online Ordering has Become a Necessity
Nearly 75 percent of the pizzeria operators surveyed report sales from online ordering. Nearly half of the respondents say that at least 18 percent or more of total sales were driven from online ordering, while 16 percent reported online sales of more than 45 percent of total sales.
The Million-Dollar Operation in Reach for More Operators
The million-dollar pizzeria has been the goal for many operators and that bar is rising. Of the independent pizzerias we surveyed with nine or fewer locations, over 40 percent of our respondents have hit the million-dollar gross annual sales mark. A staggering 20 percent have surpassed $2 million.
Pizzerias are Diversifying their Revenue Streams
During the height of the COVID-19 Pandemic, pizzerias sought new revenue streams. In our COVID-19 Pizzeria Industry Report, we found that they opened drive-thru operations as well as sectioning off parking spaces and parking lots for dining and carryout operations. Some even set up either food trucks outside of the restaurants to aid during peak rushes or sent food trucks into surrounding neighborhoods. To add revenue, pizzerias even added alcohol delivery and bodega/grocery offerings. Common grocery items included flour, yeast, produce, meats and even sanitizing supplies.
That ingenuity has continued and will thrive in 2023 in an environment of continued rising costs and a stretched labor market. Operators will have to be even more creative as many municipalities have lifted or removed some of the COVID-19 waivers on expanded seating, packaged sales and off-premise alcohol sales. Catering proves to be the biggest driver of additional revenue for 52.8 percent of pizzerias.

Making the Right Investments to Capture Catering’s Promise
As the No. 1 additional revenue generator, we tapped one of our lead freelancers — Daniel P. Smith — to dive deep into catering programs to give you insights and advice on taking catering to the next level through advancements delivery, packaging and marketing. Go to the Catering Feature now.
Third-party delivery is driving revenue for 37.2 percent. To expand: of the third-party sales, 31.9 percent of respondents said one to five percent of their total sales came from third-party and another 31.9 reaped 6-10 percent of total sales from third-party delivery. Over 40 percent saw third-party sales of over 11 percent of total sales.
Merchandise (29%) and Beer/Liquor To Go (26.9%) has also helped pizzerias diversify their revenue streams. Other revenue streams that registered with at least 10 percent of operators included mobile units, retail house-made goods and room/facility rental.
While ghost kitchen operations have experienced a spike in recent years, only 3.8 percent of our survey respondents have incorporated the revenue generation method.
Delivery Fees are Here to Stay
Gone are the days of FREE delivery. It’s a service that operators can no longer gift to the costumer. Today’s operators are either building the delivery cost into their menus, offering special-priced delivery menus or charging delivery fees. Over half of the operators in our survey indicated they charge a fee for delivery. Average fees range from $3.75-$4.25.

Pizza Delivery: To Fee or Not to Fee?
PizzaMan Dan Collier tackles the subject of delivery fees and outlines how to approach delivery fees in your pizzeria. Dan has maintained a successful delivery program for more than 30 years and he is an instructor at the International School of Pizza at Pizza Expo in Las Vegas. He offers do’s and don’ts to help guide you. Go to the Delivery Fees Feature now.
Sourcing Goods
Today’s independent pizzerias source their products from a variety of purveyors. We sought to find out where operators source goods. We found that many operations use multiple sources. The highest concentration of operators use regional distributors (62.8%) followed by national distributors (56.8%). Nearly 44 percent of pizzerias use a local wholesaler. Over 30 percent use a retail grocer or outlet and 25 percent source via a local grower or farm direct.
Food Costs Soar
With costs of goods rising, so are food costs. Maintaining a percent food cost under 22 percent in the current business climate is more challenging. Just over 25 percent of the operators we surveyed have been able to maintain food costs under 22 percent. Over 41 percent indicated a food cost of over 29 percent.
The Supply Chain Disruption Expected to Persist in 2023
Disruptions in the supply chain have reverberated across the restaurant industry. Over 80 percent of pizzerias have experienced a disruption in their supply chain since summer of 2021. Pizzerias have felt the pain in several key areas. Over 66 percent of pizzeria operators reported unavailable affected their business operation. Pizza boxes and paper products impacted more that 50 percent of the pizzerias surveyed. Other elevated supply concerns included other packaging (46.2%), cheese (39%) and flour (39.5%).

Pizza Industry Sales Forecasting and Pizza Industry Statistics
Sponsored by:
What we learned about pizza sales from the industry survey we just completed
By Jeremy White
Sales are the name of the game. So, where are things headed? What did pizzeria owners from across the United States tell us in this survey on the topic?
When asked, “How do you anticipate your gross annual sales to perform in the next 12 months?”, the biggest answer was “flat”. 20.4% issued that response. 17.5% said they expect sales to increase 5-9%, however. Another 16.2% predict a 1-4% uptick in their shops. Meanwhile, 10.6% are eyeing a 10-15% boom.
That means the number of respondents that foresee a decrease in sales is in the vast minority — 22.2% think they’ll generate fewer sales in 2023 as compared to 2022. While gross sales may not lag once raising prices are taken into consideration (92.5% say they are increasing menu prices to offset higher costs of goods sold), that doesn’t mean profits will soar. In fact, there is less optimism on that front. In all, 41% of those surveyed said their profits will decrease in the next 12 months. Add to that number the 25.8% who project profits will be flat, and you have just one-third of respondents predicting an increase in profits unfortunately.
Here is some more sales-related data from the survey, which had 754 total respondents. These numbers tell us much about where we are today as an industry — and where we might be heading.
When we asked, “What was your approximate gross annual sales volume last year?”, here were the answers:
- Under $200K — 19.6 percent
- $200-300K — 7.9 percent
- $301-400K — 5.2 percent
- $401-500K — 6 percent
- $501-700K — 8 percent
- $701-850K — 5.2 percent
- $851K-1 million — 9.7 percent
- $1.01 million-1.25 million — 7.9 percent
- $1.26 million – 1.5 million — 6.2 percent
- $1.51 million-2 million — 4.4 percent
- Over $2 million — 19.8 percent
We think the overwhelming majority of the “Under $200K” answers came from mobile pizza truck operators and seasonal businesses. The numbers tell us that 10 percent of our respondents have pizza businesses that focus on mobile units, catering or pop-ups. Most answering the survey (36 percent) label themselves as “casual dining.” 27 percent fall into the fast casual category, while 17 percent are delivery and carryout only units.
When asked about additional revenue streams, the No. 1 answer was catering (54.1 percent). That was followed by third-party delivery (35.8 percent), beer and liquor to go (23.1 percent) merchandise (22.8 percent), mobile units in addition to the brick-and-mortar (19.1 percent), room/facility rental (14.9 percent) and retail items such as sauces, dressings, etc. (13.4 percent).
Because we know the third-party delivery component remains and hot topic, this data is of particular interest. We asked survey respondents to tell us what percentage of their sales are derived from third-party delivery. Here are the answers:
- None — 57.9 percent
- 1-5% — 12.5 percent
- 6-10% — 11.1 percent
- 11-15% — 7.2 percent
- 16-20% — 4.7 percent
- 21-25% — 2.8 percent
- 26% or more — 3.8 percent
While well over half the 754 respondents say they do not work with third-party delivery companies, 18.3 percent are seeing anywhere from 6-15 percent of their sales come via this avenue.
We asked the same question for the online ordering category. Here’s what we found:
- 65% or more — 5.1 percent
- 45-64% — 11.5 percent
- 28-44% — 16.1 percent
- 18-27% — 14.6 percent
- 10-17% — 12.3 percent
- 5-9% — 6.3 percent
- Less than 5% — 7.8 percent
- None — 26.4 percent
Aside from none (we were surprised the number was as high as it was; we had predicted 20% or less would give that response in 2022), the most prevalent answer was 28-44%. While that’s a wide range no doubt, it shows just how substantial online sales can be for a pizzeria.
Considering the labor issues pizzeria owners have dealt with since the pandemic (49 percent have had to reduce operating hours as a result), it stands to reason automating orders can help reduce labor costs in addition to driving higher check averages.
Labor costs aren’t the only ones rising, either. Inflation has made the cost of goods sold take an upward trajectory as well. We asked “which of the following steps have you taken to mitigate” this. Here were the answers:
- Raise menu prices — 92.5 percent
- Reduce menu offerings — 25 percent
- Reduce portion sizes — 13.5 percent
- Change ingredients — 11.7 percent
- Replace vendor — 17.5 percent
The vendor hunt is on, and that did not surprise us as we anecdotally received that response time and time again while walking the Pizza Expo show floor.
In-Depth Analysis on the Podcast
Be sure to listen in to upcoming episodes of the Hot Slice podcast where our Editor-in-Chief, Jeremy White, will dive into these numbers with Executive Editor Denise Greer. They’ll offer insights and analysis you won’t want to miss. Go to The Hot Slice Podcast now.

Pizza Restaurant Labor Pains
Sponsored by:
Outlook is improving, but employees still a key topic
By Jeremy White
When we asked our survey respondents to “describe your overall outlook of the pizzeria industry in the next 12-18 months,” we weren’t sure what to expect. In the end, 36% were somewhat optimistic and 31% were very optimistic. We think those who had positive thoughts on the matter felt that way because their situation with employees is beginning to improve. After all, it’s difficult to grow if you don’t have the help.
When we asked, “what are your top three business priorities over the next 12 months?”, adding employees was the most common answer (38.7 percent) behind sales. And another 10.6 percent cited adding employee benefits.
Before we dive into benefits, let’s take a look at some overall trends on the subject of employees. Consider the following data we uncovered with our survey:
- 37.9% have 10 or fewer employees. 22% have 11-12.
- 29.6 percent have an average labor cost in the 23-28% range. Another 26.1% carry a labor cost between 29-35%.
- When asked if they had to adjust their operating hours due to a shortage of workers, 49% answered “yes.”
- In an effort to keep help, 83.2% of pizzeria operators have increased wages. 24.8% upped pay by 4-6% to help offset inflation. Meanwhile, a nearly identical number (24.6%) said they raised salaries by 7-11%.
Employee Benefits Matter
Recognizing that increasing pay alone isn’t enough, we then asked about benefits. Here is where things in the industry stand at the moment:
- 85.2 percent give employees free or discounted food.
- 48.2 percent offer paid time off.
- 30.3 percent provide paid sick leave.
- 28.7 percent say medical insurance is part of their benefits package.
- 19.3 percent offer dental insurance.
- 17.2 percent help with retirement planning.
- 14 percent pay or assist with advancing professional development.
- 12.1 percent take part in profit-sharing with employees.
- 7.7 percent include life insurance in their lineup of benefits.
- 3.5 percent provide education assistance.
On top of that, the majority of operators (84 percent) increased pay by some degree. In 2022, it appears this is truly the cost of doing restaurant business as pizzerias have had to compete with retail outlets such as Target or Best Buy like never before.
This may contribute to elevated labor costs short-term (26.1 percent cite a labor cost in the 29-35 percent range) as operators learn to balance this expense with proper menu pricing as inflation dominates headlines. It may also lead to operators taking on more part-time employees as a way of curtailing the expense of providing costly benefits.

Explore the Latest Pizzeria Menu Trends
Sponsored by:
To stay up to date on the latest pizzeria menu trends, we examined what’s hot on menus, what’s being added and what’s being removed. From pizza styles to other menu categories, operators shared what’s trending on menus across America.
As many restaurant brands have cut menus, pizzerias have maintained their menu options (66% made no cuts to menus. Of those, 38 percent even expanded menu offerings).
5 Things to Know about Pizza Menus:
- Buffets are out with only seven percent reporting still offering them.
- The slice game in American pizzerias is strong. Forty-seven percent sell slices.
- Gluten-free (gluten-friendly) crust is strong with nearly 63 percent of pizzerias offering the option.
- Cauliflower crust is on the rise. A rarity on menus just a few years ago, cauliflower crusts are on 35.5 percent of pizzeria menus.
Who’s Got Style
Pizzeria operators and pizza fans are adamant about their favorite pizza styles. Over the past several years, we’ve seen a movement towards offering multiple pizza styles. How has the trend resonated across the country? According to our Industry Survey, roughly 64 percent of respondents menu more than one pizza style. Just over 21 percent offer four or more styles.
New York Style is No. 1.
Burrata & Hot Honey Pizza, L’Industrie, Brooklyn, NYC
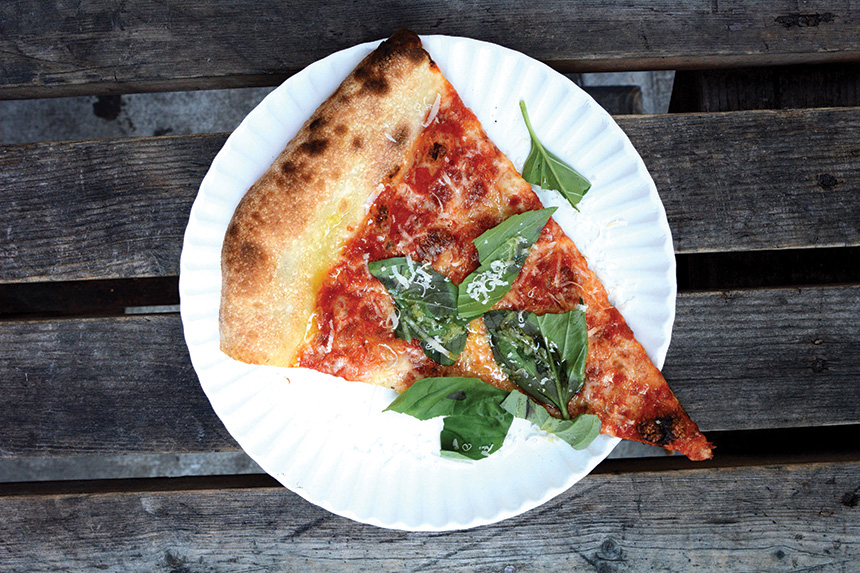
New York-style pizza reigns supreme as the most popular pizza on pizzeria menus across America. New York-style pizza has long been the most popular pizza in America. The first licensed pizzeria to open in the U.S. was Lombari’s, which opened in New York City in 1905. The versatile New York slice is crispy, a bit chewy, foldable and light on the toppings.
A surprise in the Top 5 pizzas offered in American pizzerias is the Chicago thin. Also called tavern-style pizza, these pies typically feature a crispy crust. They’re also quite often cut into squares. We rank America’s Top 10 Pizza Styles on pizzeria menus. The Top Five include:
- New York
- Traditional American
- Sicilian
- Chicago Thin
- Deep Dish
Rounding out the Top 10 are…
- Neapolitan
- Detroit
- Grandma
- California/American Artisan
- Chicago Thick
As operators look to update and modify their menus, we sought to find out what pizza styles they intend to add. Nearly 54 percent indicated they do not intend to add a pizza style. Of those who will add a pizza style, Detroit was the top choice. The style features a medium-thick crust that’s light and airy on the inside, yet crispy on the outside. The Top Five include:
- Detroit
- Deep Dish
- Sicilian
- Grandma
- Roman

The Detroit Style
Learn more about this distinctive style that originated from the Motor City in A Guide to Detroit Pizza. This is a comprehensive look at the style including history, characteristics, recipes and dough expert advice.
Trending Pizza Toppings
We have seen almost every pizza topping imaginable listed on pizzeria menus. We sought to find out what’s hot in pizza toppings. The findings blend a mix of classic toppings and innovative and creative options.
The Top Five Pizza Toppings list has remained the same for the past several years. But this year, a new ingredient has entered the Top 5 — Bacon. The “everything is better with bacon” mantra has made its way to pizza.
The Top 5 Pizza Toppings list includes:
- Pepperoni
- Sausage
- Mushroom
- Extra Cheese
- Bacon

BACON, Welcome to the Top 5 Pizza Toppings!
This fatty and salty delight can be used in many ways as a pizza topping. Don’t miss John Gutekanst’s bacon story, “Crispy Business”. He details bacon history and varieties with menu ideas and recipes. Go to the Bacon Feature now.
Rounding out the Top 10 includes:
6. Chicken
7. Onion
8. Green/Red Bell Peppers
9. Ham
10. Black Olives
It’s clear that meat is still king atop pizzas, making up five of the Top 10 Pizza Toppings. Chicken has risen as a popular pizza topping. Its ascent follows a global increase in poultry consumption, according to the USDA.
 Yes, pineapple has found its way onto our Top 20 Pizza Toppings list. The controversial topping has won over consumers to become a permanent fixture on pizzeria offerings. Let’s dive even further into popular toppings:
11. Meatballs
12. Basil
13. Pineapple
14. Canadian Bacon
15. Jalapenos
16. Beef
17. Tomatoes
18. Banana Peppers
19. Fresh Garlic
20. Salami
The Plant-based Movement
 While not yet on the Top 20, plant-based meats and cheeses are one of the biggest hot trends in pizza toppings. Plant-based ingredients are becoming mainstream on pizza menus. Plant-based meats and cheeses are the top new toppings pizzeria operators have introduced over the past year. According to our survey, plant-based options were also the most researched and tested new item over the past year.
Our findings track with national data. According to The Good Food Institute’s U.S. Retail Market Insights: Plant-based Foods, the plant-based foods market is worth $7.4 billion, up six percent from the previous year. Plant-based food sales grew three times faster than total food sales in 2021. The market is made up of not only vegan and vegetarians, as ominvores and flexitarians are also consuming plant-based foods. Amongst flexitarians, 98 percent of those consumers who buy plant-based meats also buy animal meat, according to the Plant Based Foods Association’s Consumer Insights.

What’s in Plant-based Pepperoni and Mozzarella?
Plant-based is the hottest trend in pizza. Many ask, ‘what’s in plant-based pepperoni and mozzarella?’ We put one of our top freelance writers on the topic. Check out what she found out in What’s in Plant-Based Pepperoni and Mozzarella? Pizzeria operators can incorporate these innovative ingredients to answer consumer demand. Go to the Plant-based Pepperoni & Cheese Feature.
Introducing….
 As you look for the hottest new pizza toppings to add, seeing what’s trending on menus across the country can help you hone in on your selection. When we asked operators what pizza toppings they’ve added in the past year, we received everything from traditional to innovative and groundbreaking. We’re highlighting some of the standouts below:
Specialty & New Cheeses. From Burrata, Buffalo Mozzarella to herb-infused cheeses, pizzerias are introducing more than a standard mozzarella.
Pulled pork and brisket. Prepared various ways, pork and brisket have broken into many pizza topping lists.
Hot Honey. The spicy and sweet concoction has gone mainstream.
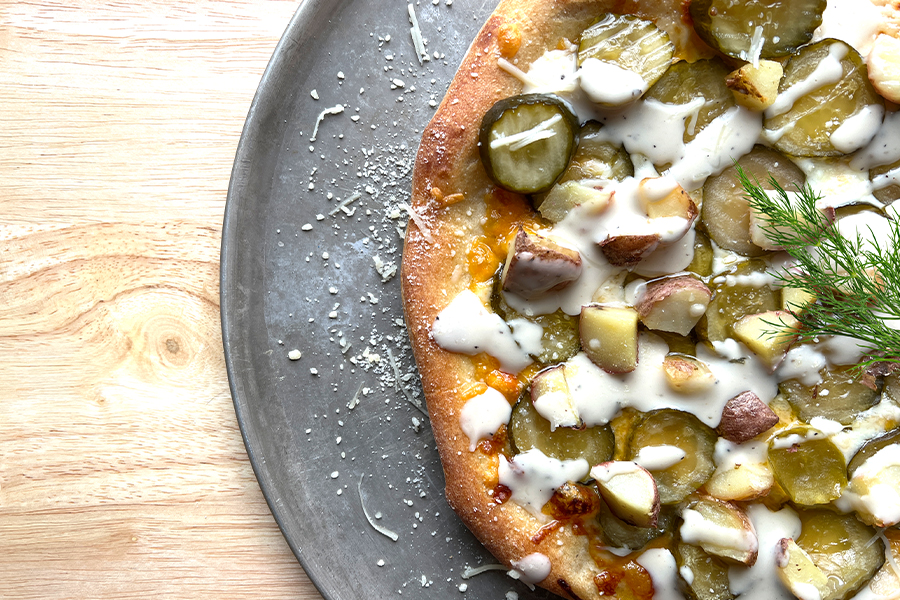
Pickles. Their salty and sour taste is proving to be a good pairing for other ingredients.
Chorizo. The Mexican spiced sausage is resonating with pizza lovers.
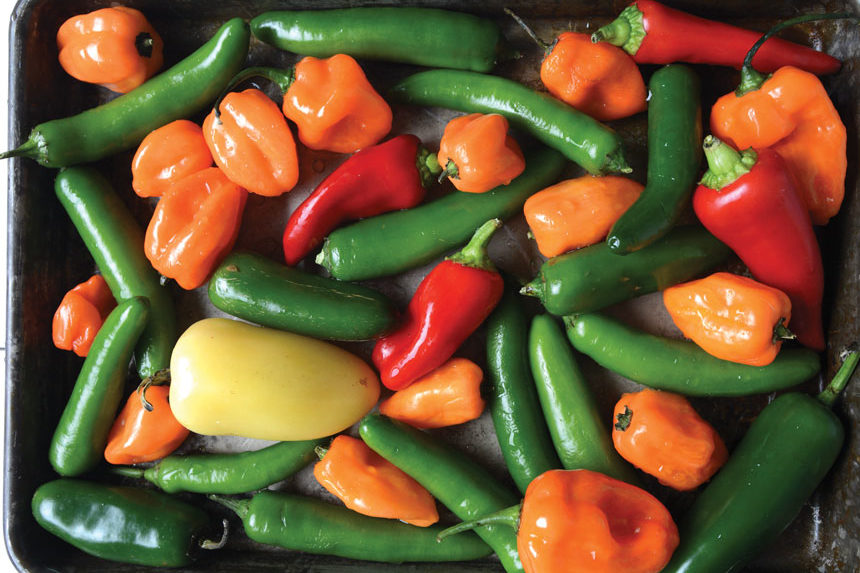 Mild and Hot Peppers. From mild banana and sweet picante to hot jalapenos, peppers are increasing their frequency on toppings lists.
Meatballs. This staple is still increasing in popularity as a pizza topping.
Cured Meats. From traditional salumi to the spreadable Njuda and pancetta, cured meats are being added to the pizza menu.
Arugula. The peppery green has become a favorite finishing pizza topping.
Other interesting additions to pizzeria toppings lists this year include hot chili oil, fried chicken, artichoke, caramelized onion, seafood (crab, lobster, shrimp, etc.) sweet mayonnaise chili sauce and berries.
What’s Off the List
While the majority of operators didn’t remove a pizza topping from their list over the past year, other removed items like anchovies, olives, potato, Canadian bacon, roasted peppers, spinach and ground beef.
Non-Pizza Menu Movements
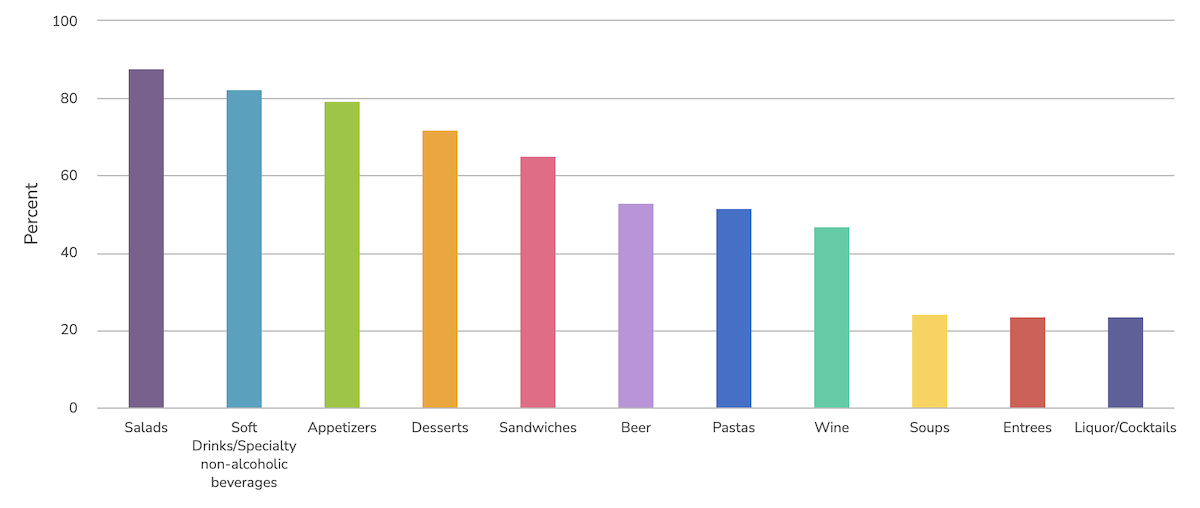
Salads are the most popular non-pizza menu category. Nearly 88 percent of pizzerias surveyed menu salads, followed by appetizers (78.9%) and desserts (69.9%). Sandwiches are on the menu in 65.1 percent of pizzerias. Pastas appear on 50.1 percent of pizzeria menus. Soups and entrees are the least menued items at pizzerias.
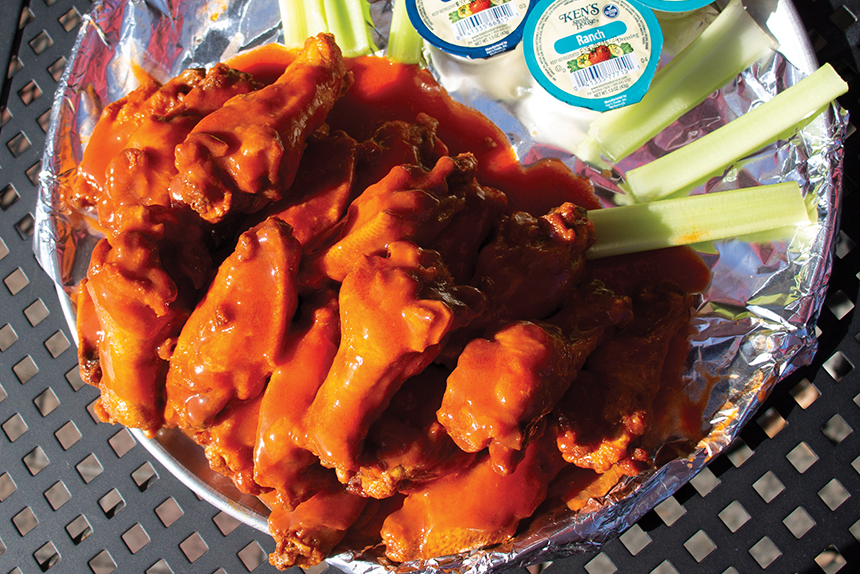 Let’s drill down to individual non-pizza menu items. There is a clear top contender for the top-selling non-pizza item: wings. Chicken wings have had a rocky few years with supply shortages and price hikes but have remained the best-selling item aside from pizza. Garlic appetizers, whether bread, breadsticks or knots, also sell well. Pastas, such as lasagna and spaghetti, also remain hits. Subs and calzones were high-selling options as well.
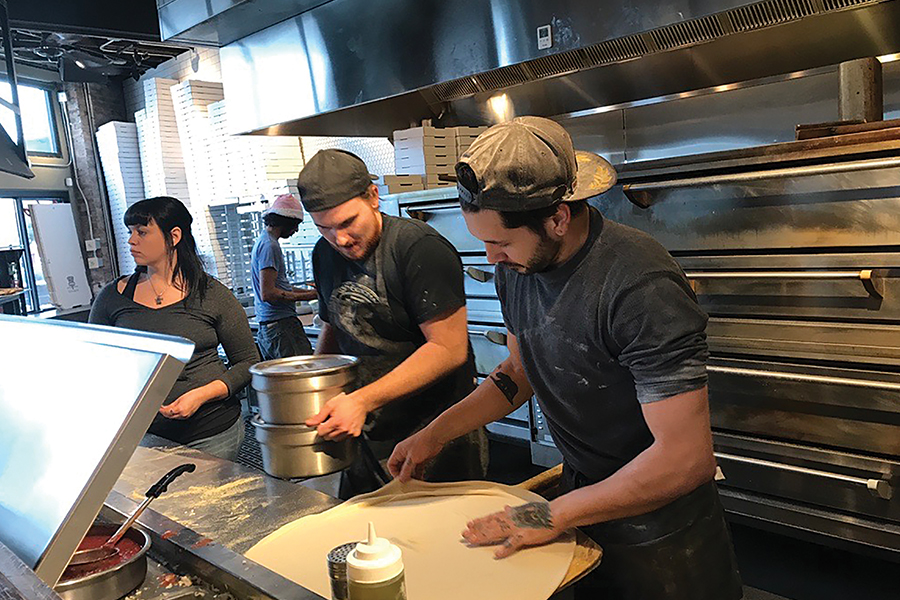
Pizza Making Breakdown
Independent pizzerias overwhelmingly choose to make pizza dough in house (92%). But the way pizza makers form dough varies from shop to shop. With many pizzerias offering multiple pizza styles. Hand formed is the most popular, followed by hand tossed. Pressed/Sheeted and Rolled made up less than 20 percent, respectively.
While conveyors are the workhorse of the chains, independents favor deck ovens by more than 15 percent over conveyor and 13 percent over Stone/Brick Hearth. Rotary and Convection each represent five percent, while countertop has emerged for catering and off-site events.
Oven power has become a hot topic in 2023. With advances in oven technology, Electric has gained ground over the past few years. Gas remains the primary way to fuel American pizzeria ovens at 78.5 percent. While the first pizzeria ovens in the U.S. were coal-burning, coal and coal alternatives have plummeted to less than two percent.

Pizza Today Magazine 2023 Content Sneak Peek
Over the next several months, the pages of Pizza Today Magazine and pizzatoday.com will dive deeper into individual menu trends to give you ideas and recipes. Here are some of the topics already in production: chicken wings, meatballs, extra cheese, pulled pork, Detroit Pizza, Deep Dish Pizza, garlic knots and chicken.

Marketing Matters in the Pizza Industry
Sponsored by:
Marketing is an area that is vastly different based on location demographics and market. This is a collective look at how marketing is represented, in general, across all pizzeria operators we surveyed.
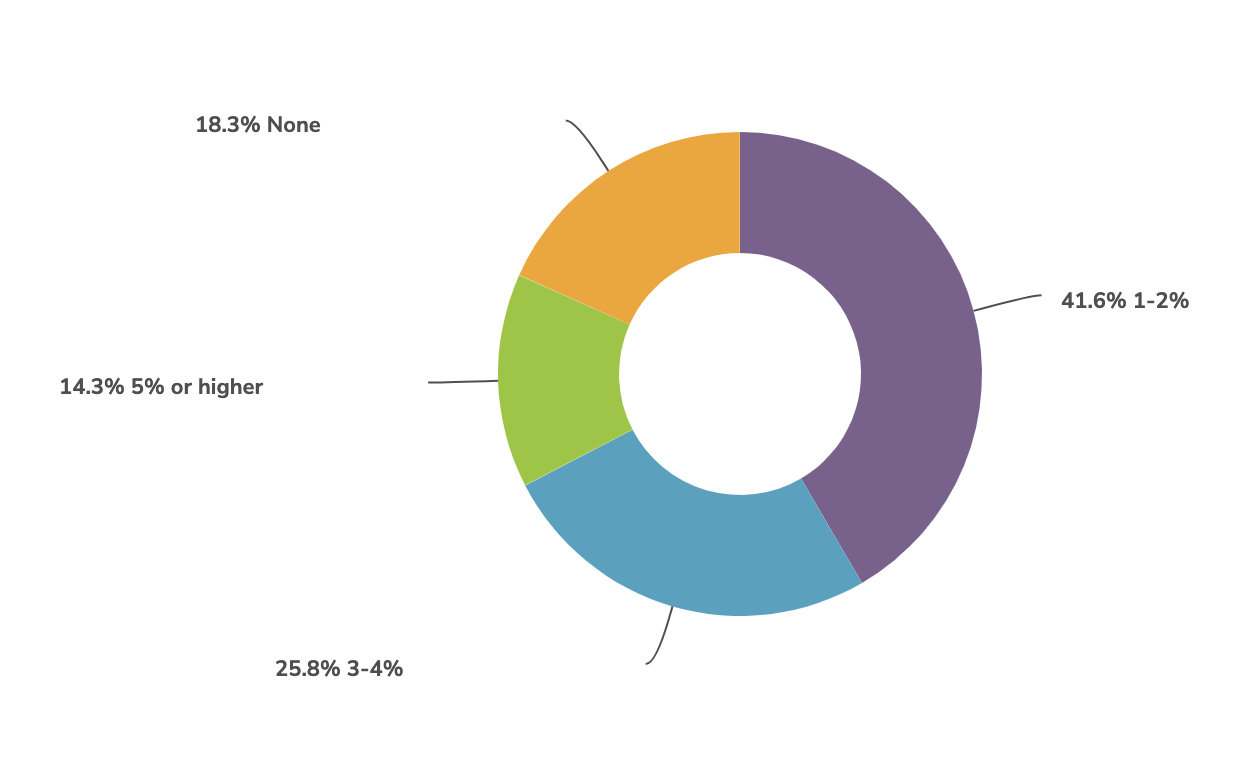
Word of mouth has long reigned the prevailing marketing method in pizzerias. But times are changing. Today’s pizzerias are investing in marketing. Approximately 82 percent of pizzerias surveyed spend at least one percent of their annual sales on marketing — with 43 percent dedicating one to two percent, and 26 percent of our survey respondents budgeting three to four percent. Still, roughly 19 percent budget zero for marketing.
2023 Restaurant Marketing Trends to Watch
We’ve scoured dozens and dozens of 2023 marketing trend predictions to give you a look at what’s hot and what’s relevant to pizzerias. Check out 10 marketing trends to watch in 2023:
- Social presence will continue to be paramount with the following three areas leading the emphasis on major platforms: short-form video, influencer campaigns and social commerce (buying directly from social accounts).
- Marketing campaigns will be driven more than ever by analysis of market and demographic from first-party data with more precision.
- Voice Search will require pizzerias to have tact-sharp search engine optimization (SEO) to be found when users prompt “Hey, Siri”, “Hey Alexa” or “Hey Google” with local pizza questions.
- Customers seek more hyper-personalized marketing specific to their lives and interests that operators acquire from POS systems and loyalty programs.
- Cause marketing never goes out of style. Hone in on the organizations that are important to you and fit your overall brand.
- If you are in the digital ad game, interactive ads are where it’s at.
- Harness your partnerships for mutual marketing gain.
- Text campaigns continue to gain traction, but only if you are very strategic about how and when you contact customers.
- There is more prominence of owners or chefs being the face of a brand, including being the authority on what you do best.
- Reputation management is vital to your business growth. Expand your strategies to cover your online presence.

Don’t sleep on the short-form social video trend
The social powerhouse TikTok started a revolution that has reverberated to every major social channel. Instagram uses Reels, and later Facebook adopted the feature. YouTube has added Video Shorts to its repertoire. Twitter is the latest to add a full screen video option. The sweet spot of video length for TikToks and Reels (Instagram & Facebook) is often suggested at seven to 15 seconds. Go to the full article on video shorts. Go to the Video Short Feature now.
Social Influence
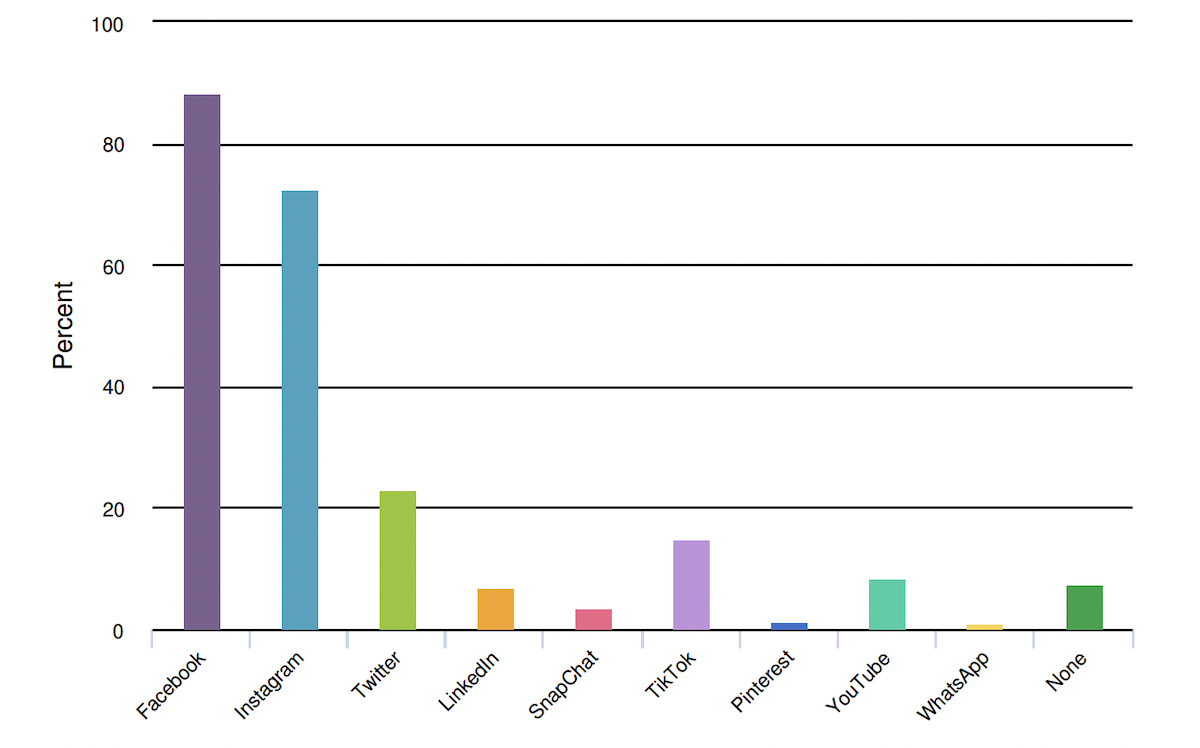
Social media remains the dominant marketing tool. Facebook, Instagram, Twitter and TikTok are popular channels to promote pizza businesses. Roughly 88 percent of American pizzerias promote their businesses through Facebook, followed by Instagram (72.4%). Twitter (23%) and TikTok (14.8%). When asked which social channel provides the best ROI, Facebook led at 57 percent and Instagram followed at 23 percent.
Let’s look at some emerging social platforms that you should watch and test. Here are some of the social movers and shakers to watch in 2023:
- TikTok takeover has commenced. With billions of users worldwide, TikTok is predicted to be the social platform of 2023.
- YouTube has consumer influence. Get to know and understand how to grow your brand presence with this video social format.
- It’s time to expand your business network with LinkedIn. The networking platform is all business and pros in every industry are flocking to it make business connections. We’re there and you should be too.
- You’ve probably never heard of BeReal, but you will. If you are marketing to younger Gen Z and even Gen Alpha, its downloads reached over 50 million in October 2022. This photo-sharing app’s benchmark is authenticity and highlights its users in real-time.

Pizza Today Magazine Content Sneak Peek: May 2023
Getting social, America’s most successful pizzerias have been able to use Facebook, Instagram and other outlets to drive business. In the May 2023 issue, social media experts and successful pizzeria owners alike will weigh in with the current best practices for harnessing the power of social media.
Advertising Drive
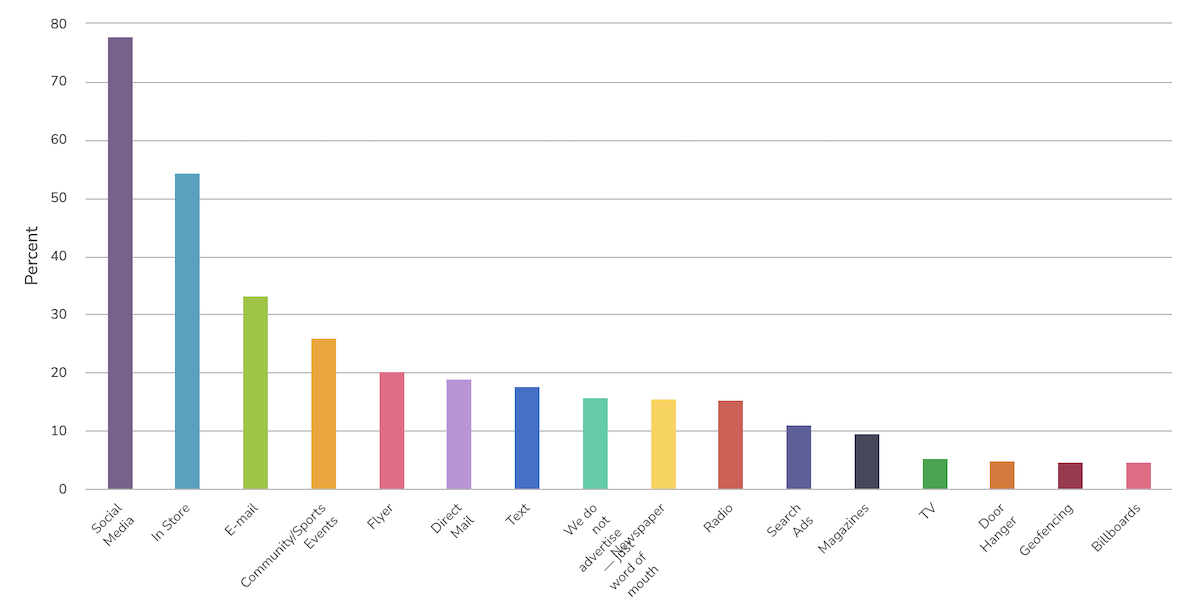
When asked where pizzerias advertise, social media dominated at 76.8 percent of the pizzerias. In-store advertising remains the vital advertising tool at 52.4 percent of those surveyed. Nearly 17 percent do not advertise at all and just focus on word of mouth.
The Top 5 Marketing Channels operators are using to reach their audiences are:
1. Social Media
2. In Store
3. E-mail
4. Community/Sporting Events
5. Flyer
Advertising Channels to Watch
There is no shortage of avenues pizzeria operators can take to put their messages out to your markets. We’ve examined the advertising channels that are on the rise. They include:
- Text & Push Notification. Text registered on our survey at nearly 18 percent. As personalization and targeted campaigns increase, that number is expected to grow.
- Social Ads, specifically video ads. Be where your consumers are. Social ads drive high ROI and can be tailored to hyper-specific target markets.
- Connected TV Ads. These ads would appear on targeted streaming devices. A great advantage to this form of advertising is that they can be interactive.
- Digital Out-of-Home (DOOH) Advertising. Think next-level billboard advertising out in the general public, even restrooms and transportation stops. This can be video, animation and even real-time social activity. This channel is being powered by advertising technology that allows companies to use real-time data, geofencing and retargeting tactics.
- In-Game Advertising. While out of reach for many, this mode is continuing to gain steam, especially for those restaurants targeting Millennials, Gen Z and the emerging Generation Alpha.

Pizza Today Magazine Content Sneak Peek: June 2023
What new trends have emerged in the world of digital advertising? In the June 2023 issue, we look at ROIs and follow strategies on e-mail database management practices, mobile SMS and notification marketing, and more.
As you plan upcoming marketing strategies, keep our findings for reference. And remember the No. 1 marketing concept that should lead your strategy is authenticity.

Technomic Pizza Consumer Trends
Sponsored by:
Our pizzeria industry survey is the most expansive and detailed research we’ve ever conducted. More than 750 respondents answered a series of questions designed to yield the most reliable data that paints the most accurate picture of exactly where the industry stands today and where it may be headed.
But what we did not do is poll the end user of your product — pizza consumers. That’s outside our wheelhouse and areas of expertise, so we turned to our friends from Technomic for help on that lift through the 2022 Technomic Pizza Consumer Trend Report, Technomic Inc. Here’s a buckshot smattering of some important insights from the customer perspective that we think will be of interest and use to you:
- Consumers prefer the build your own pizza option 36% of the time.
- 33% prefer heavy cheese coverage.
- The five most preferred cheeses are, in order: mozzarella, Parmesan, provolone, cheddar, Monterrey Jack.
- Only 28% of consumers say they are likely to order dessert pizzas.
- Even fewer, 24%, are likely to order breakfast pizzas.
- 42% find an online ordering system where they can track their pizza order to be appealing.
- 38% want curbside pickup availability.
- 23% of American consumers would like to order pizza from their smart TV. That’s a 20% increase from 2020.
- Only 19% want to order pizza via QR codes.
- 28% of consumers say it’s important that the restaurants they order from have sustainable packaging.
- 21% are willing to pay more for pizza in eco-friendly sustainable packaging. That’s up 18% from 2020.
- 47% would like more restaurants to offer natural ingredients.
- 31% would like to see organic ingredients.
- 22% said they’d like restaurants to offer plant-based items.
- Only 23% said they would eat more pizza if healthier options were available.
- Meanwhile, 22% said they consider nutritional content when ordering pizza.

Pizza Industry Outlook
Sponsored by:
The world pizza market is growing. The market is expected to increase by $42.2 million by 2025, according to a Technavio release. North America is expected to see 44% of that growth. While industry indicators give a broad scope, we sought to take the pulse of the independent pizzeria operator. As we talk to pizzeria operators across the country, there is an uncertainty as they look forward to the coming year. Driven by volatility in inflation and cost of goods, operators are cautiously optimistic. Nearly 69 percent of operators remain optimistic about the pizzeria industry this year. Of that, 33.6 percent are very optimistic. Another 22 percent are neutral on the subject.
Business Priorities
We asked operators to select their top three business priorities for the coming year. The top three include:
- Grow sales
- Maintain current business
- Add employees
Other business priorities that also drew attention were:
- Sustainability
- Grow new unit(s)
- Add new revenue stream(s)
Cost of Goods
With rising costs of goods and inflation, pizzerias need to be agile. When asked how pizzeria operators have mitigate the rise, 93 percent raised their menu prices. Nearly 26 percent re-evaluated their menus and reduced offerings. Over 17 percent replaced vendors. Another 15 percent reduced portion sizes and 11 percent changed ingredients.
Technology Investment
Investing technology has been a game changer for many operations, from streamlining operations, saving on labor costs and increasing bottom-line sales. We asked operators to select all of the technology purchases they’ve made since summer 2021.
While off-premise sales were projected to rise long before the COVID-19 Pandemic, the event sped up the process. Operators shifted and brought in new technology to help. The shift hasn’t stopped. POS systems and online orders are the most invested technology. Loyalty systems and phone systems were also added or upgraded. A fraction of operators also investing tablets for servers. One-third of operators did not make any technology investments.
A Pizzeria Renaissance
From the show floor and competitions at International Pizza Expo and Pizza & Pasta Northeast to in-store operation and kitchen innovations, the pizza industry is experiencing a renaissance similar to invigoration of pizza chains in the 1980s. Nearly 44 percent of operators surveyed agree, while another 36 percent remained neutral.
Selling the Business
On the ground level, Pizza Today noticed a trend of establish operators retiring or leaving the business. We asked operators if they’ve considered selling the business in the past year. Roughly 34 percent answered yes. Nearly 14 percent of operators intend to sell their pizzeria in the next year. Whether currently considering selling, it’s important for an operator to plan their long-term exit strategy. We also asked operators what their exit strategy is. Over 42 percent plan to pass the business onto children or other family members. Another 27 percent will sell to an employee(s) or manager(s) followed by selling to a broker at 26.7 percent.
About the Survey
From July 2022 through August 2022, Pizza Today conducted an extensive survey of its readership with 60 questions, taking participants between eight to 10 minutes to completed. The survey included pizzeria profile questions and was divided into various topics impacting American pizzerias. More than 750 operators participated in the survey. Of those respondents, 479 were independent pizzeria operators with nine or fewer locations. Respondents represented all 50 states.
